Graphs
All the graphs and table on this page will get recreated every night with the newest values.

All the graphs and table on this page will get recreated every night with the newest values.
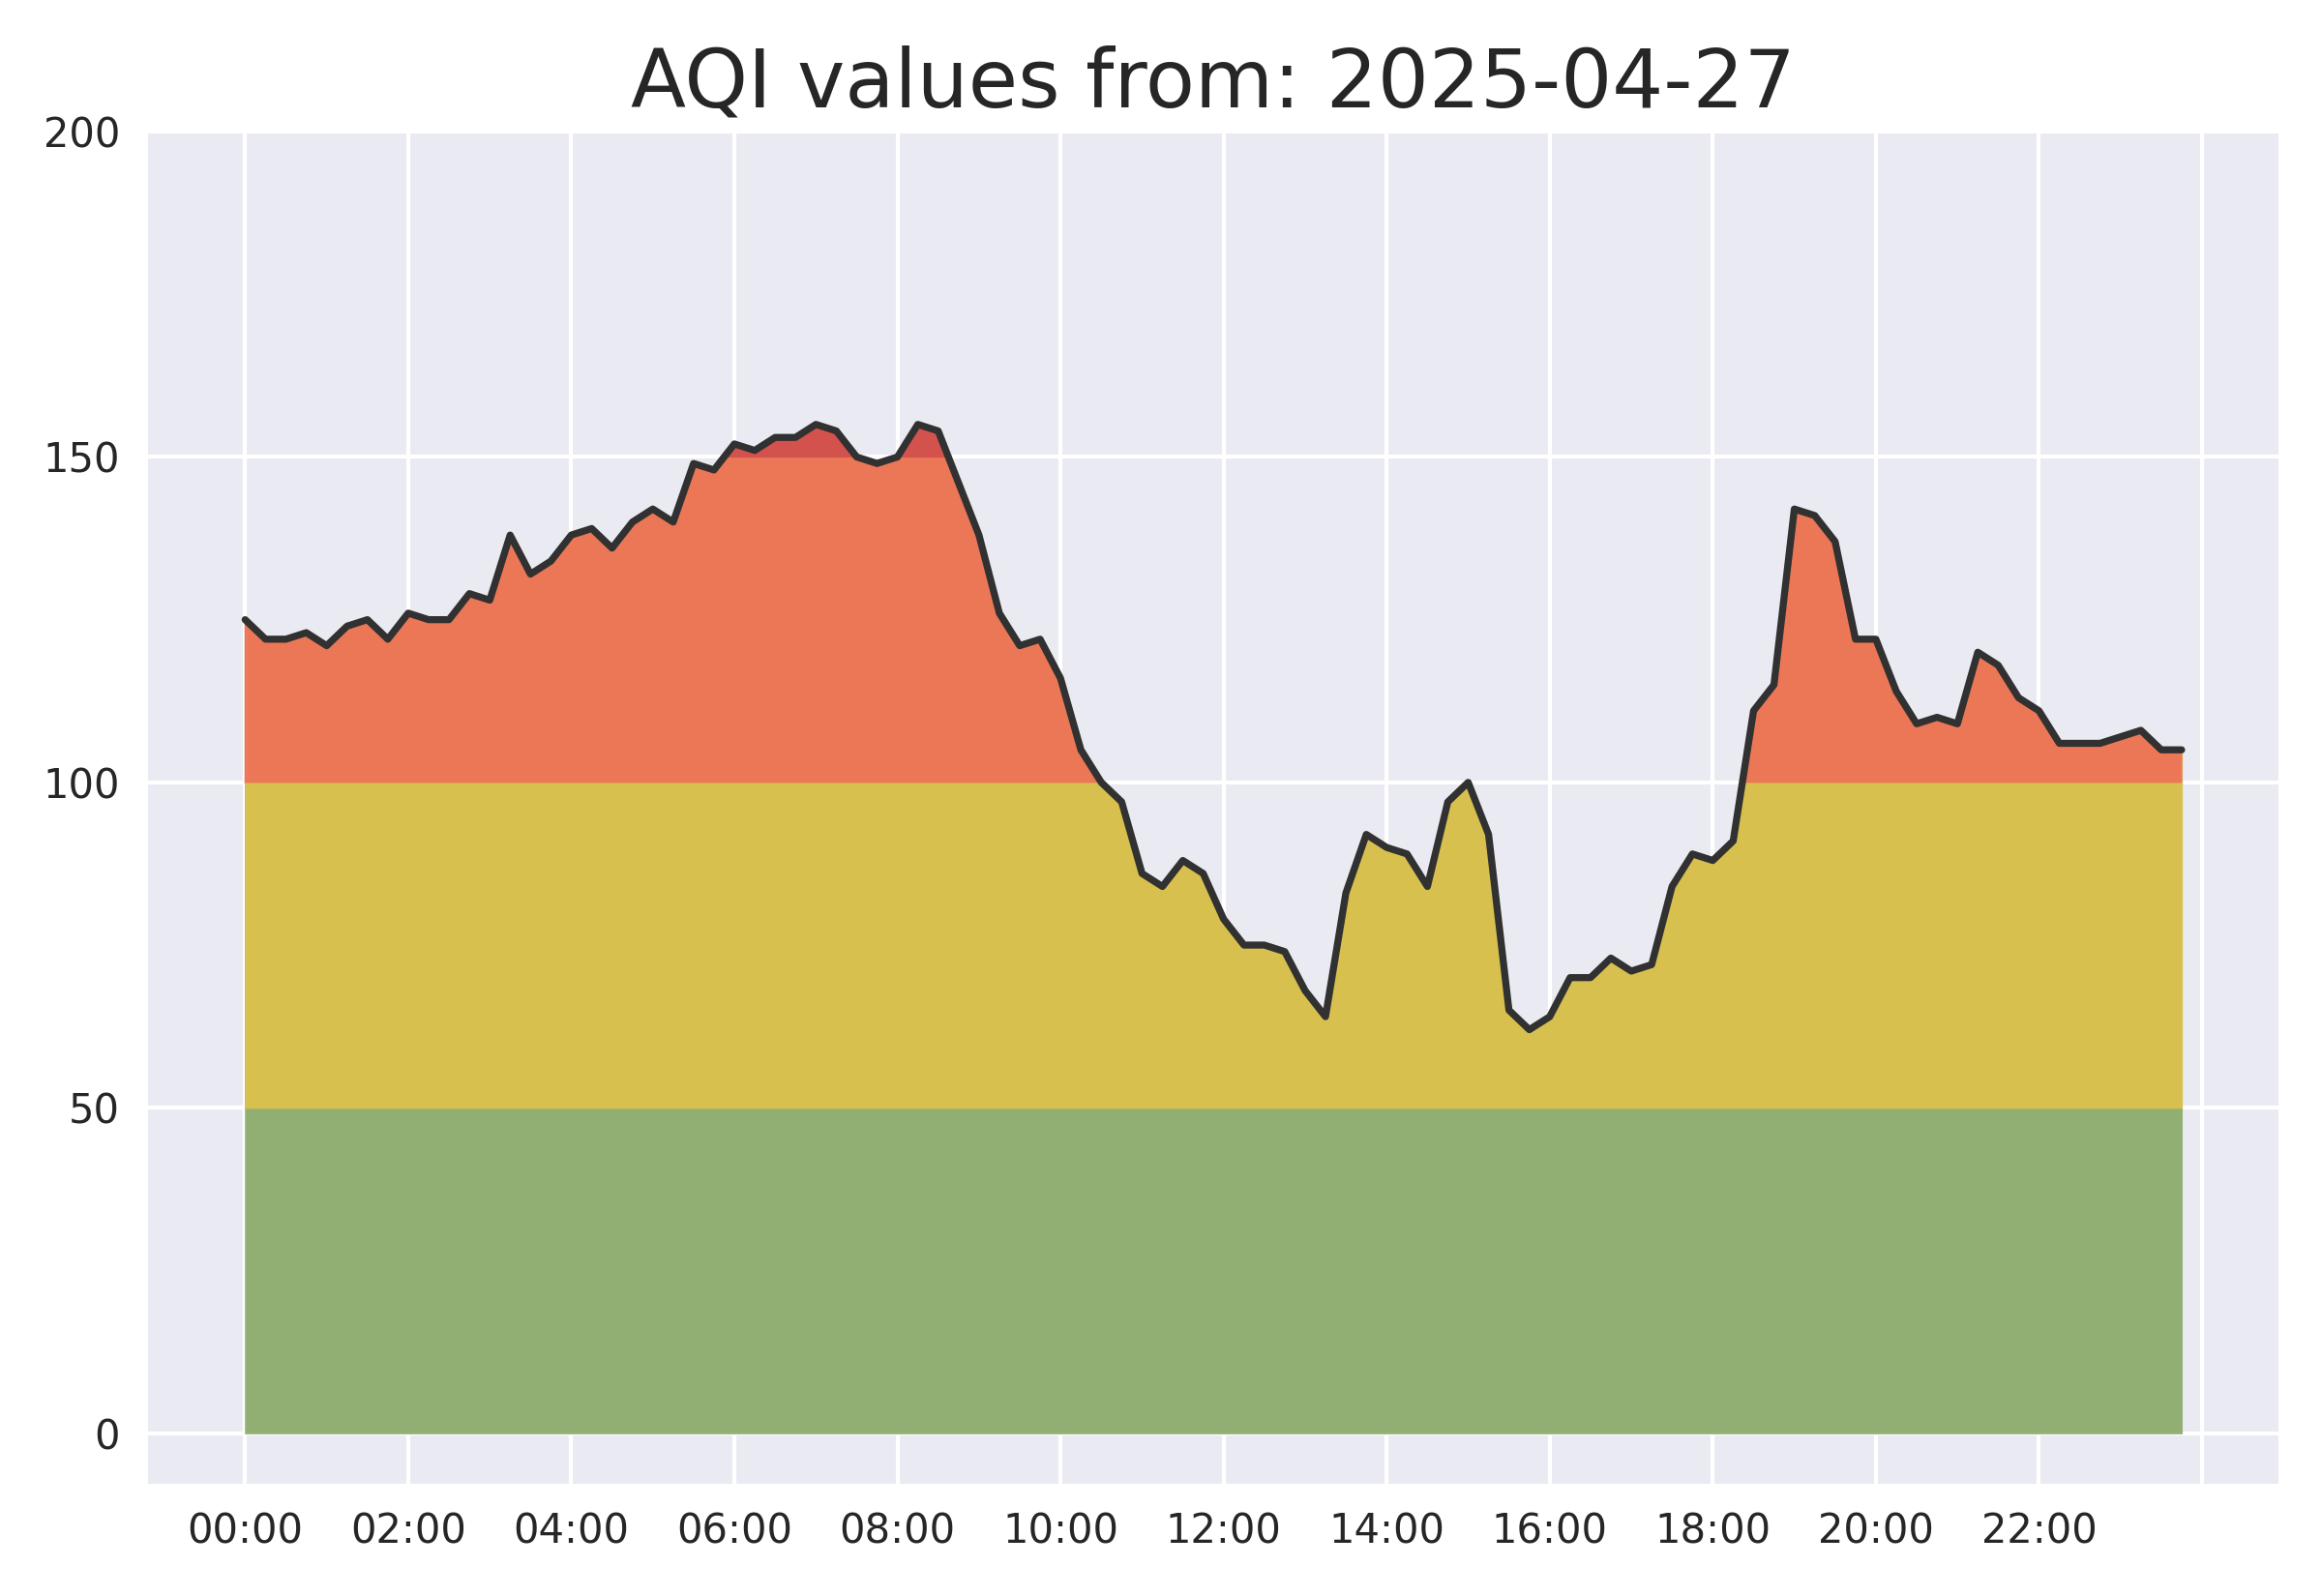
Three days ago
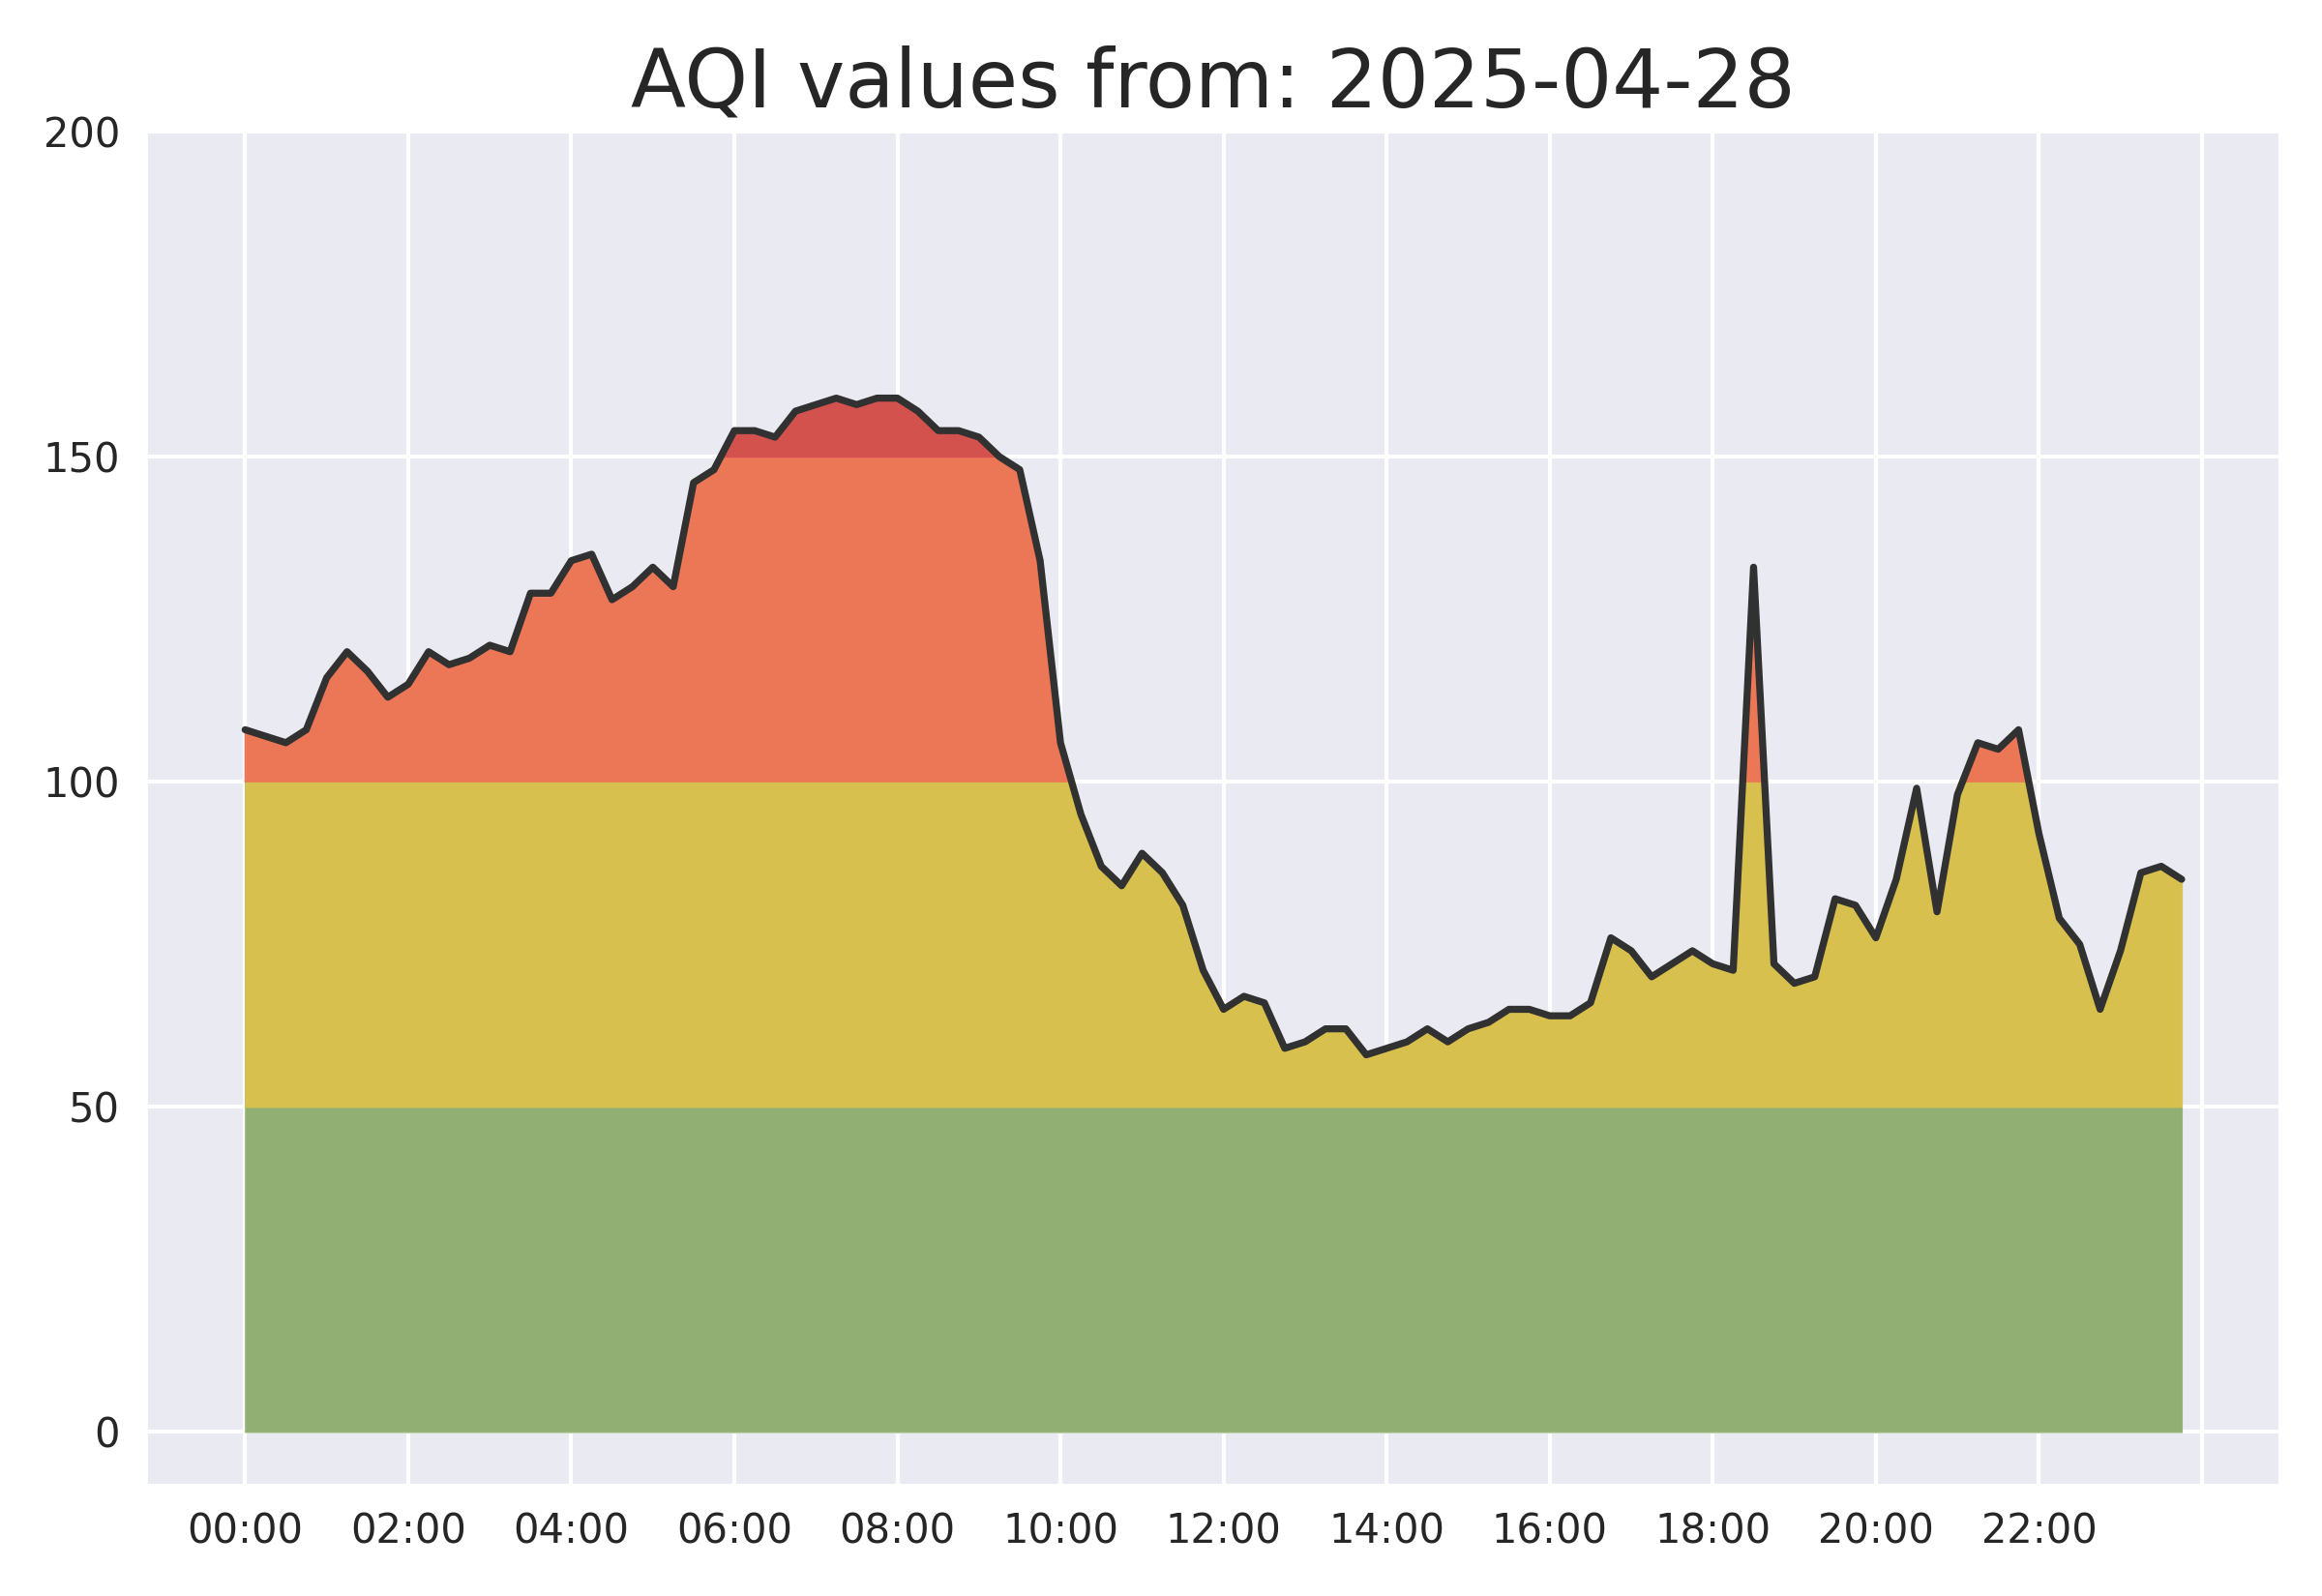
Two days ago
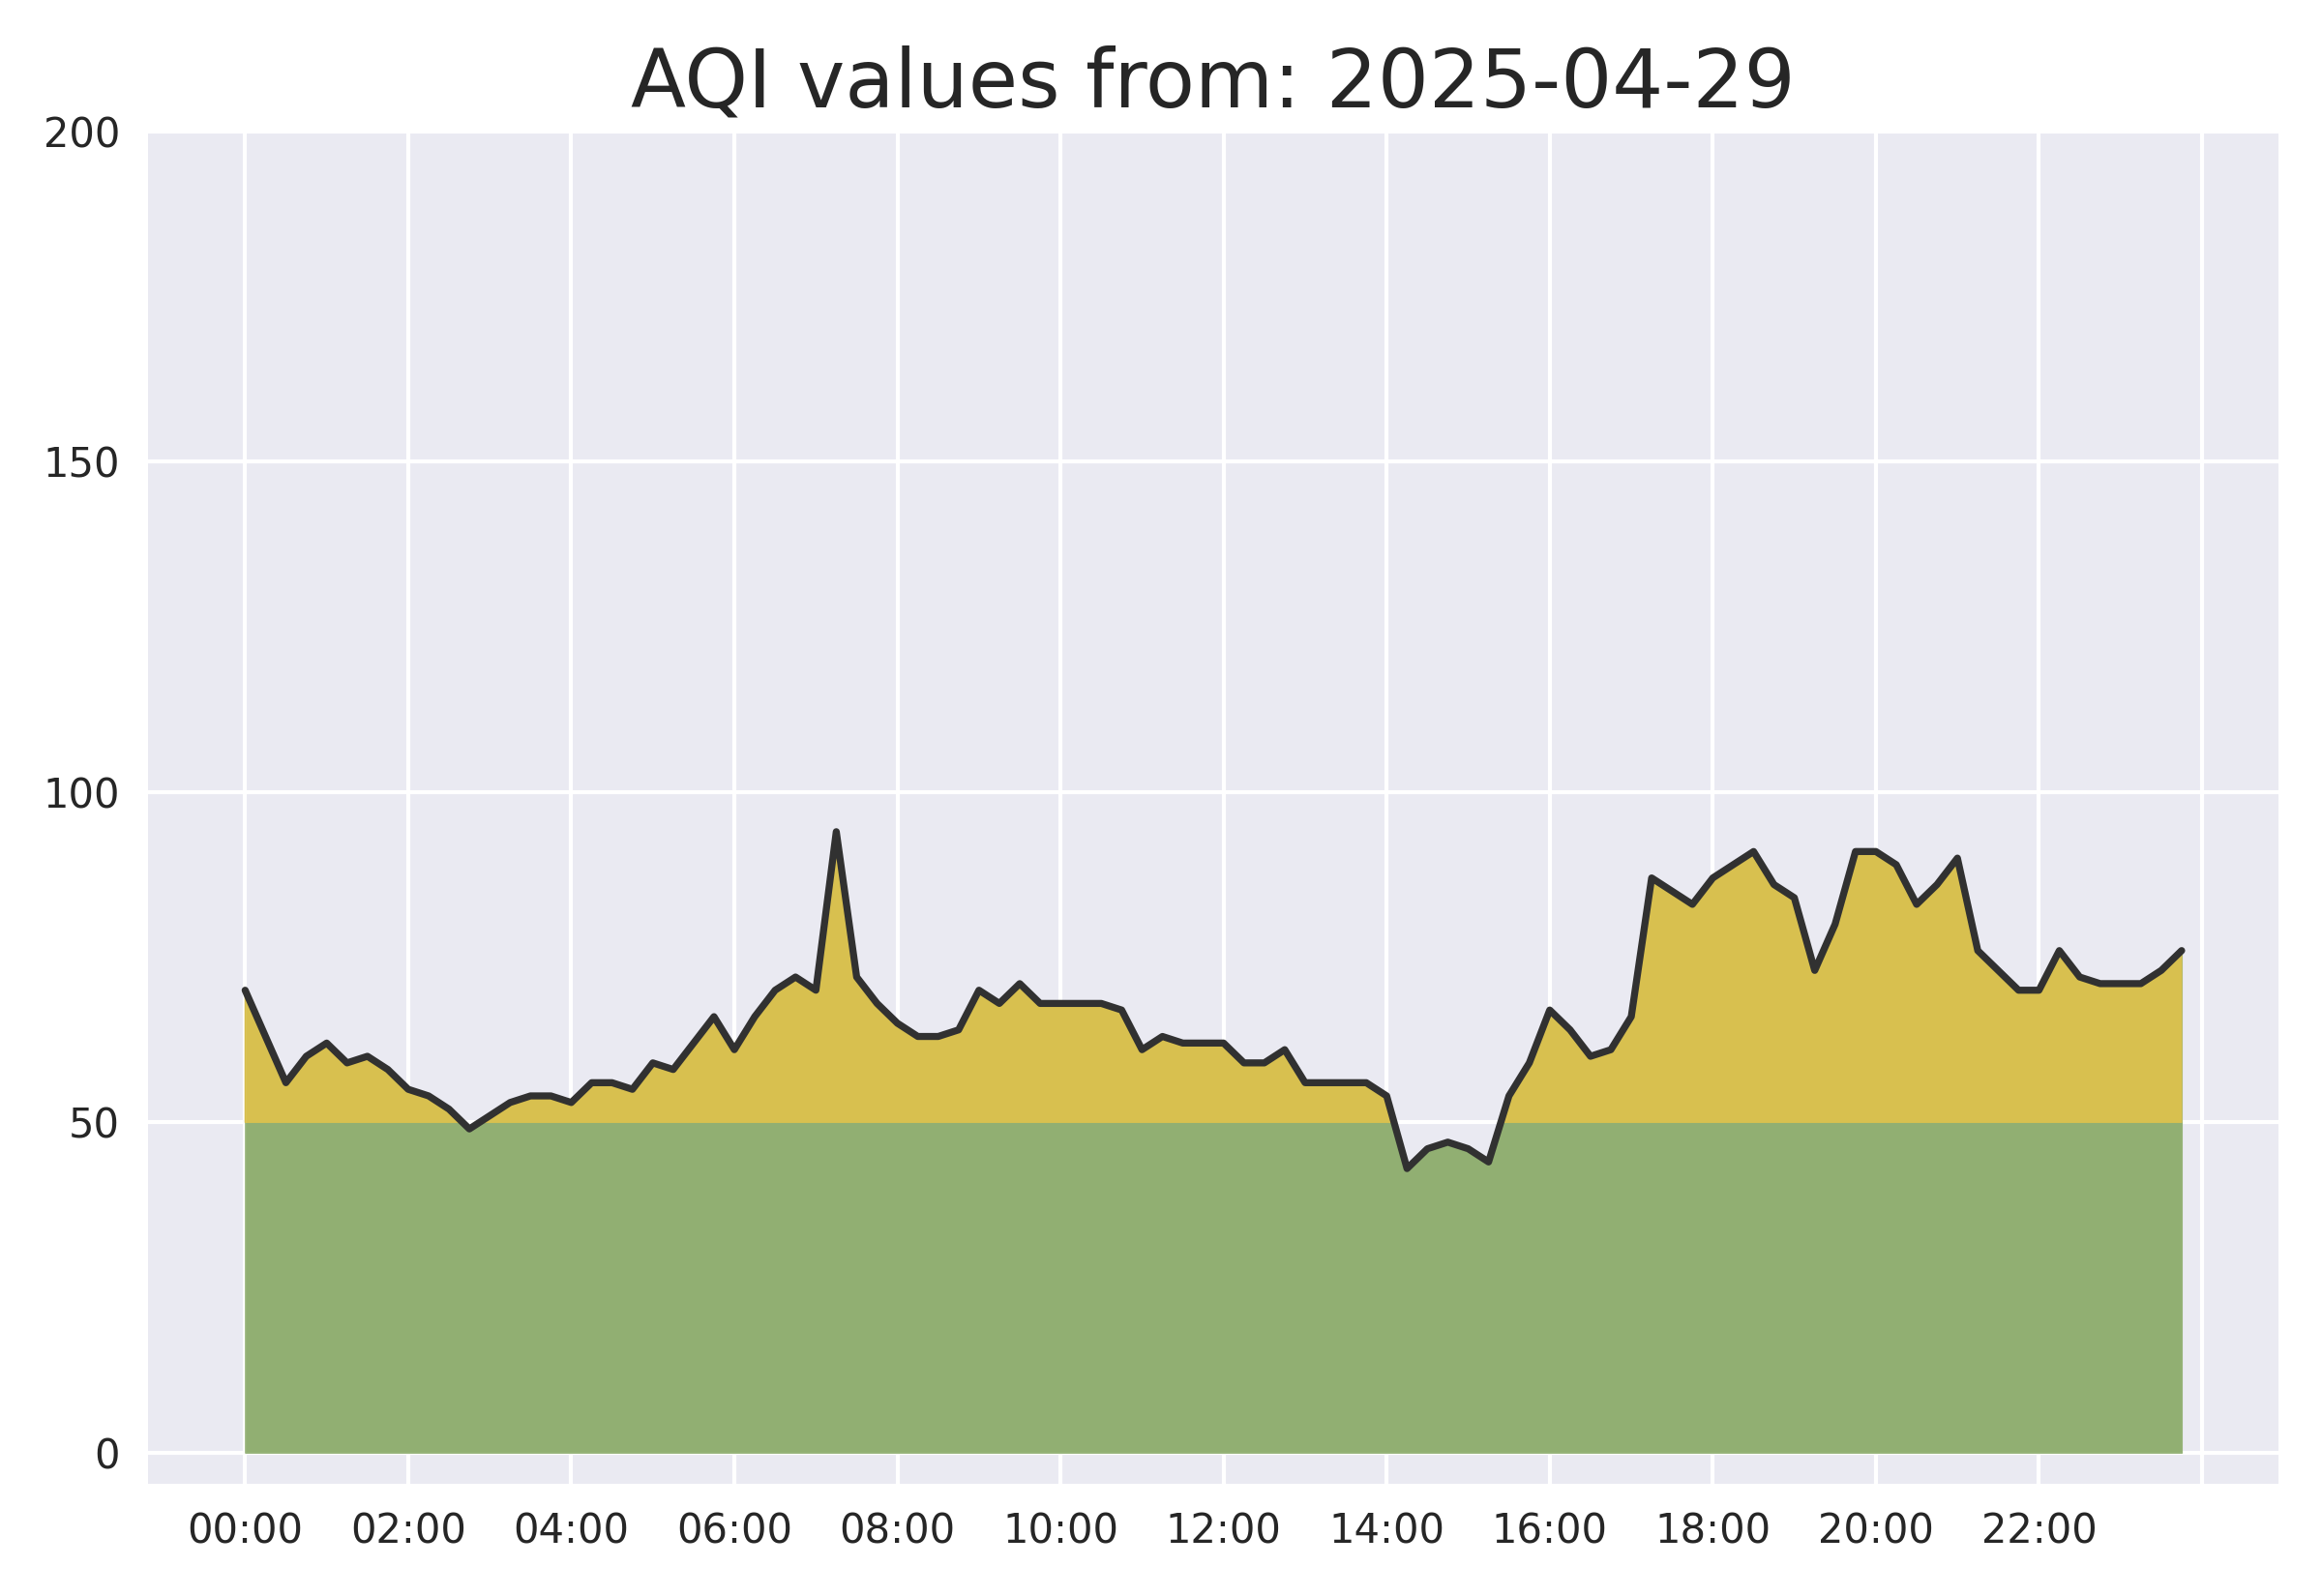
Yesterday
There is no healthy level of pollution. Particle matter (PM) are defined in two different sizes: PM 2.5 which represents particle sizes smaller than 2.5 µm or less than 1/20th of the diameter of a human hair and PM 10 which represents particle sizer smaller than 10 µm or 1/5th of the diameter of a human hair.
The WHO is providing more details on their website regarding particle matter and their health implications. On Wikipedia there are some interesting links to studies for further reading.
Particle matter sizes smaller than 2.5µm are the most problematic as these particles will find their way through the lungs into the bloodstream.
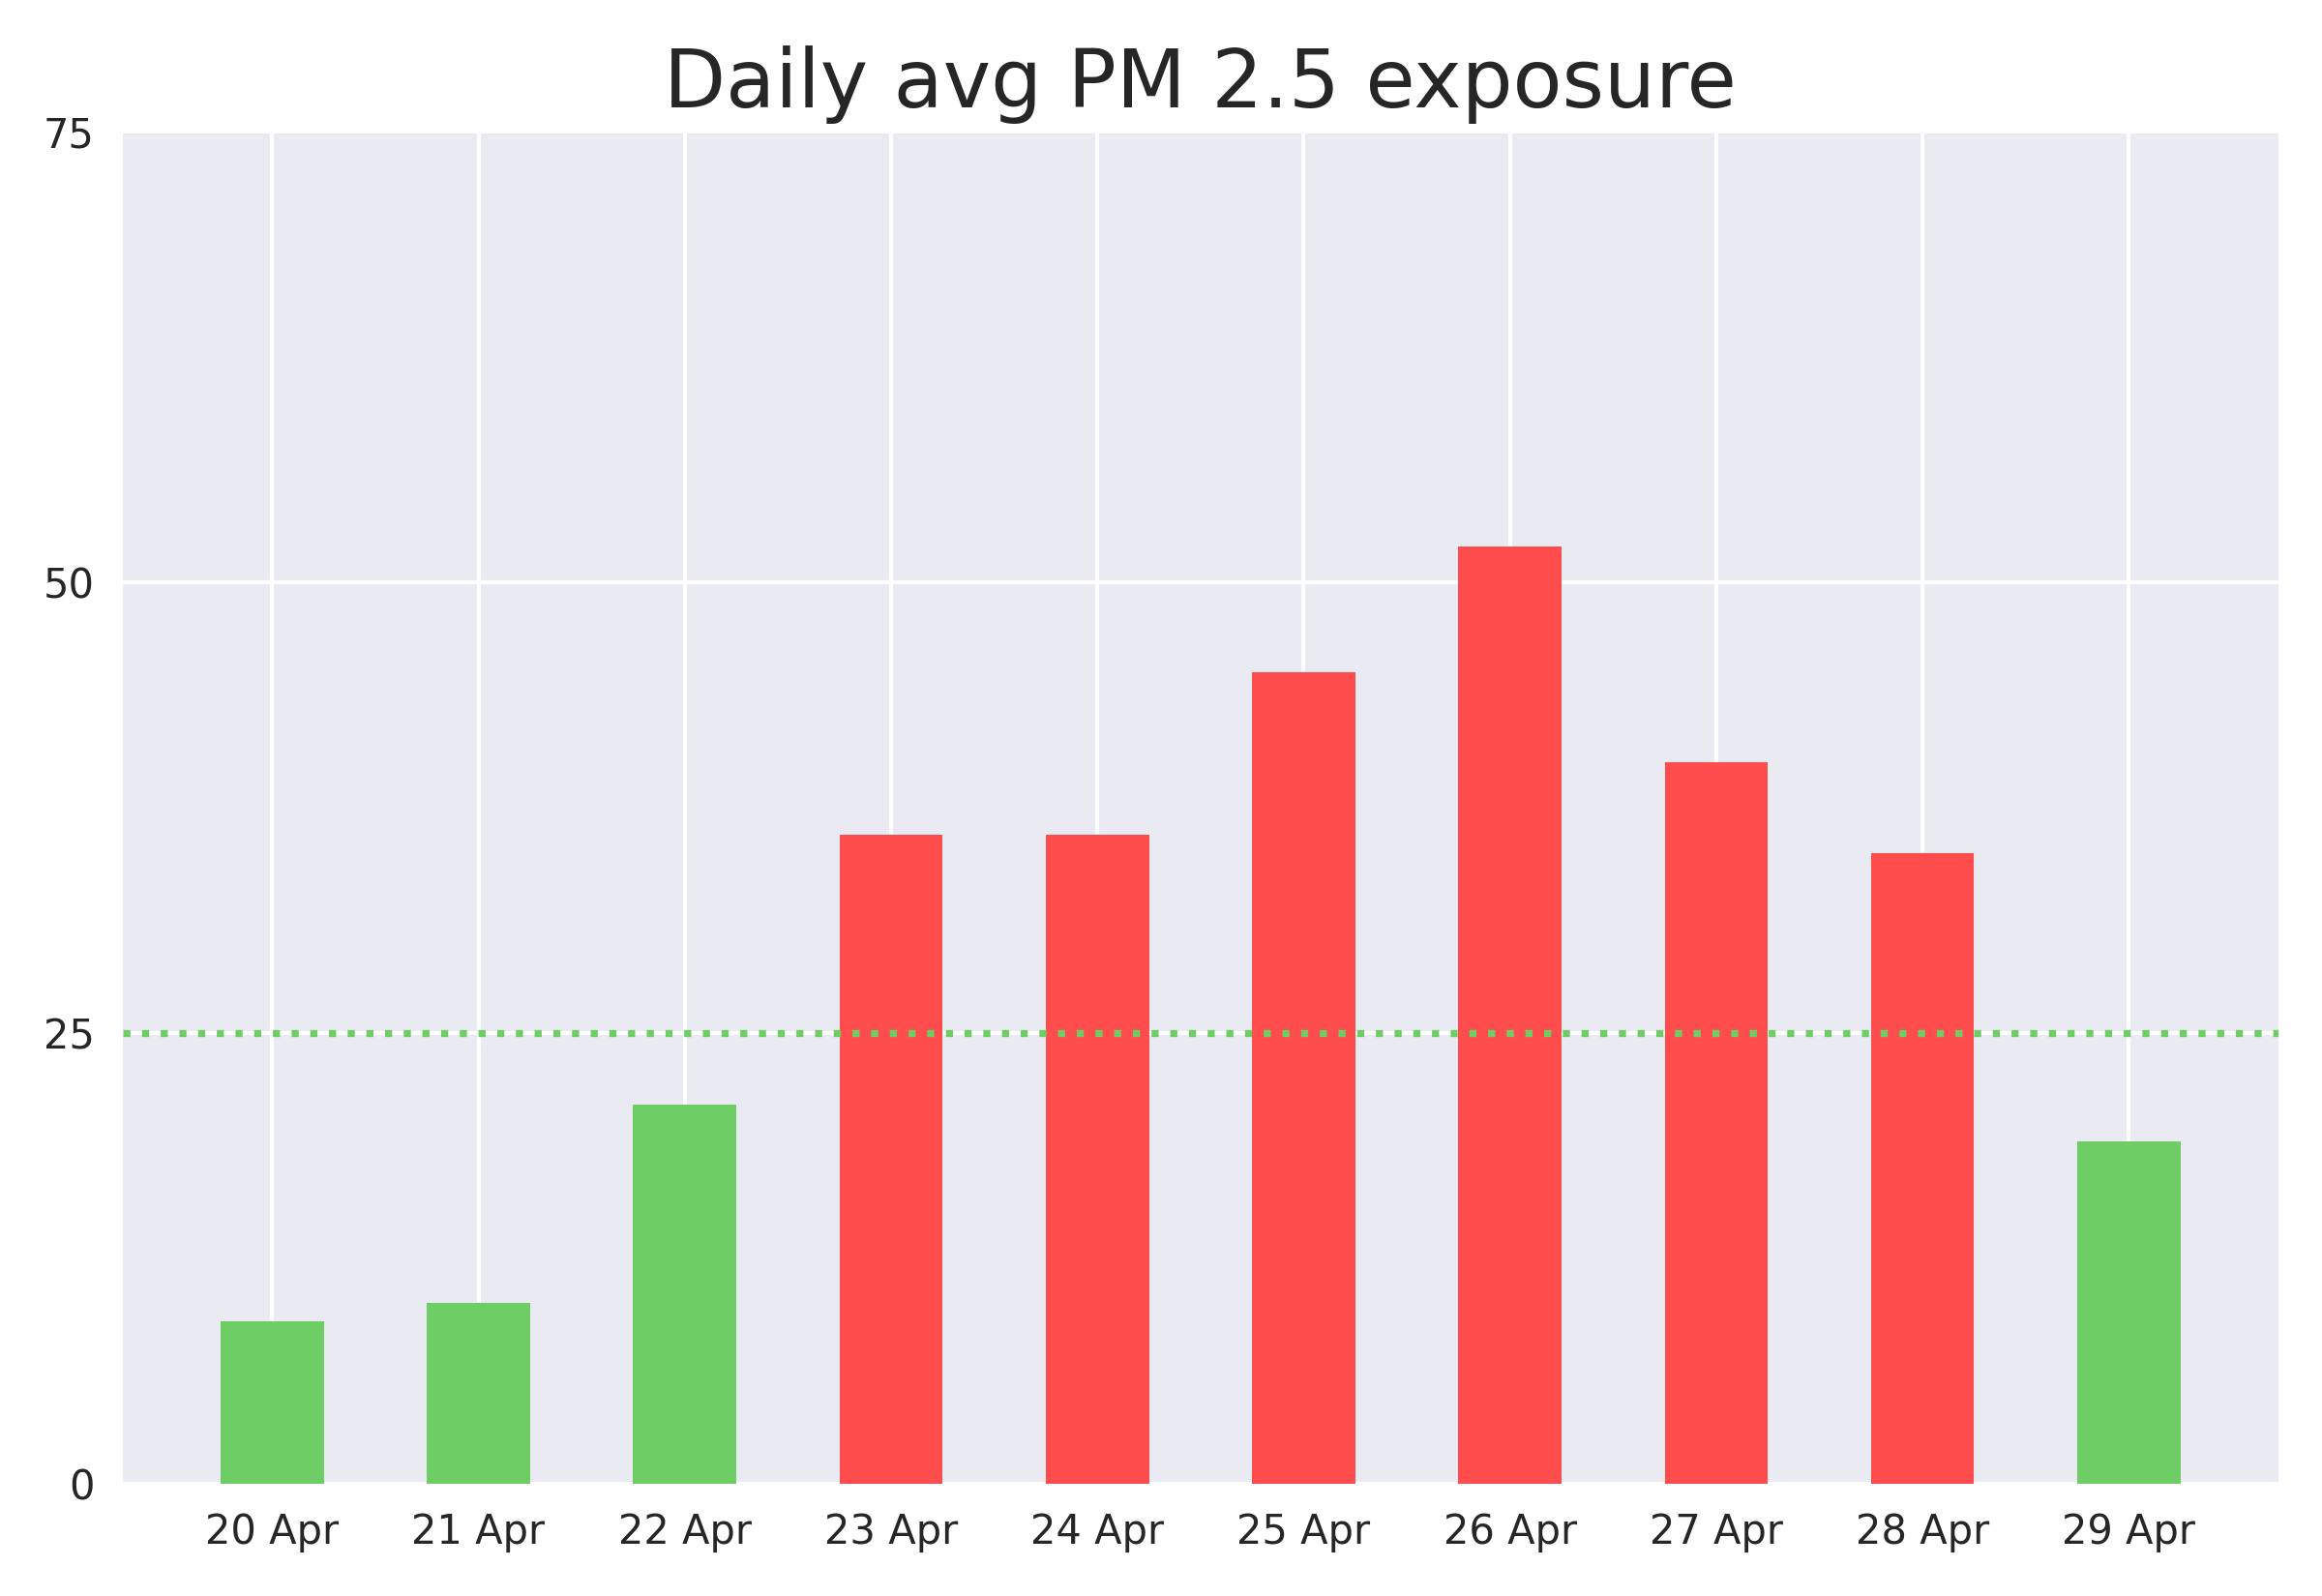
The WHO Air quality guideline values set a 25 µg/m³ 24-hour average as an upper level threshold. In the 10 days overview you can see:
Green: Daily average exposure below 25 µg/m³
Red: Daily average exposure above 25 µg/m³
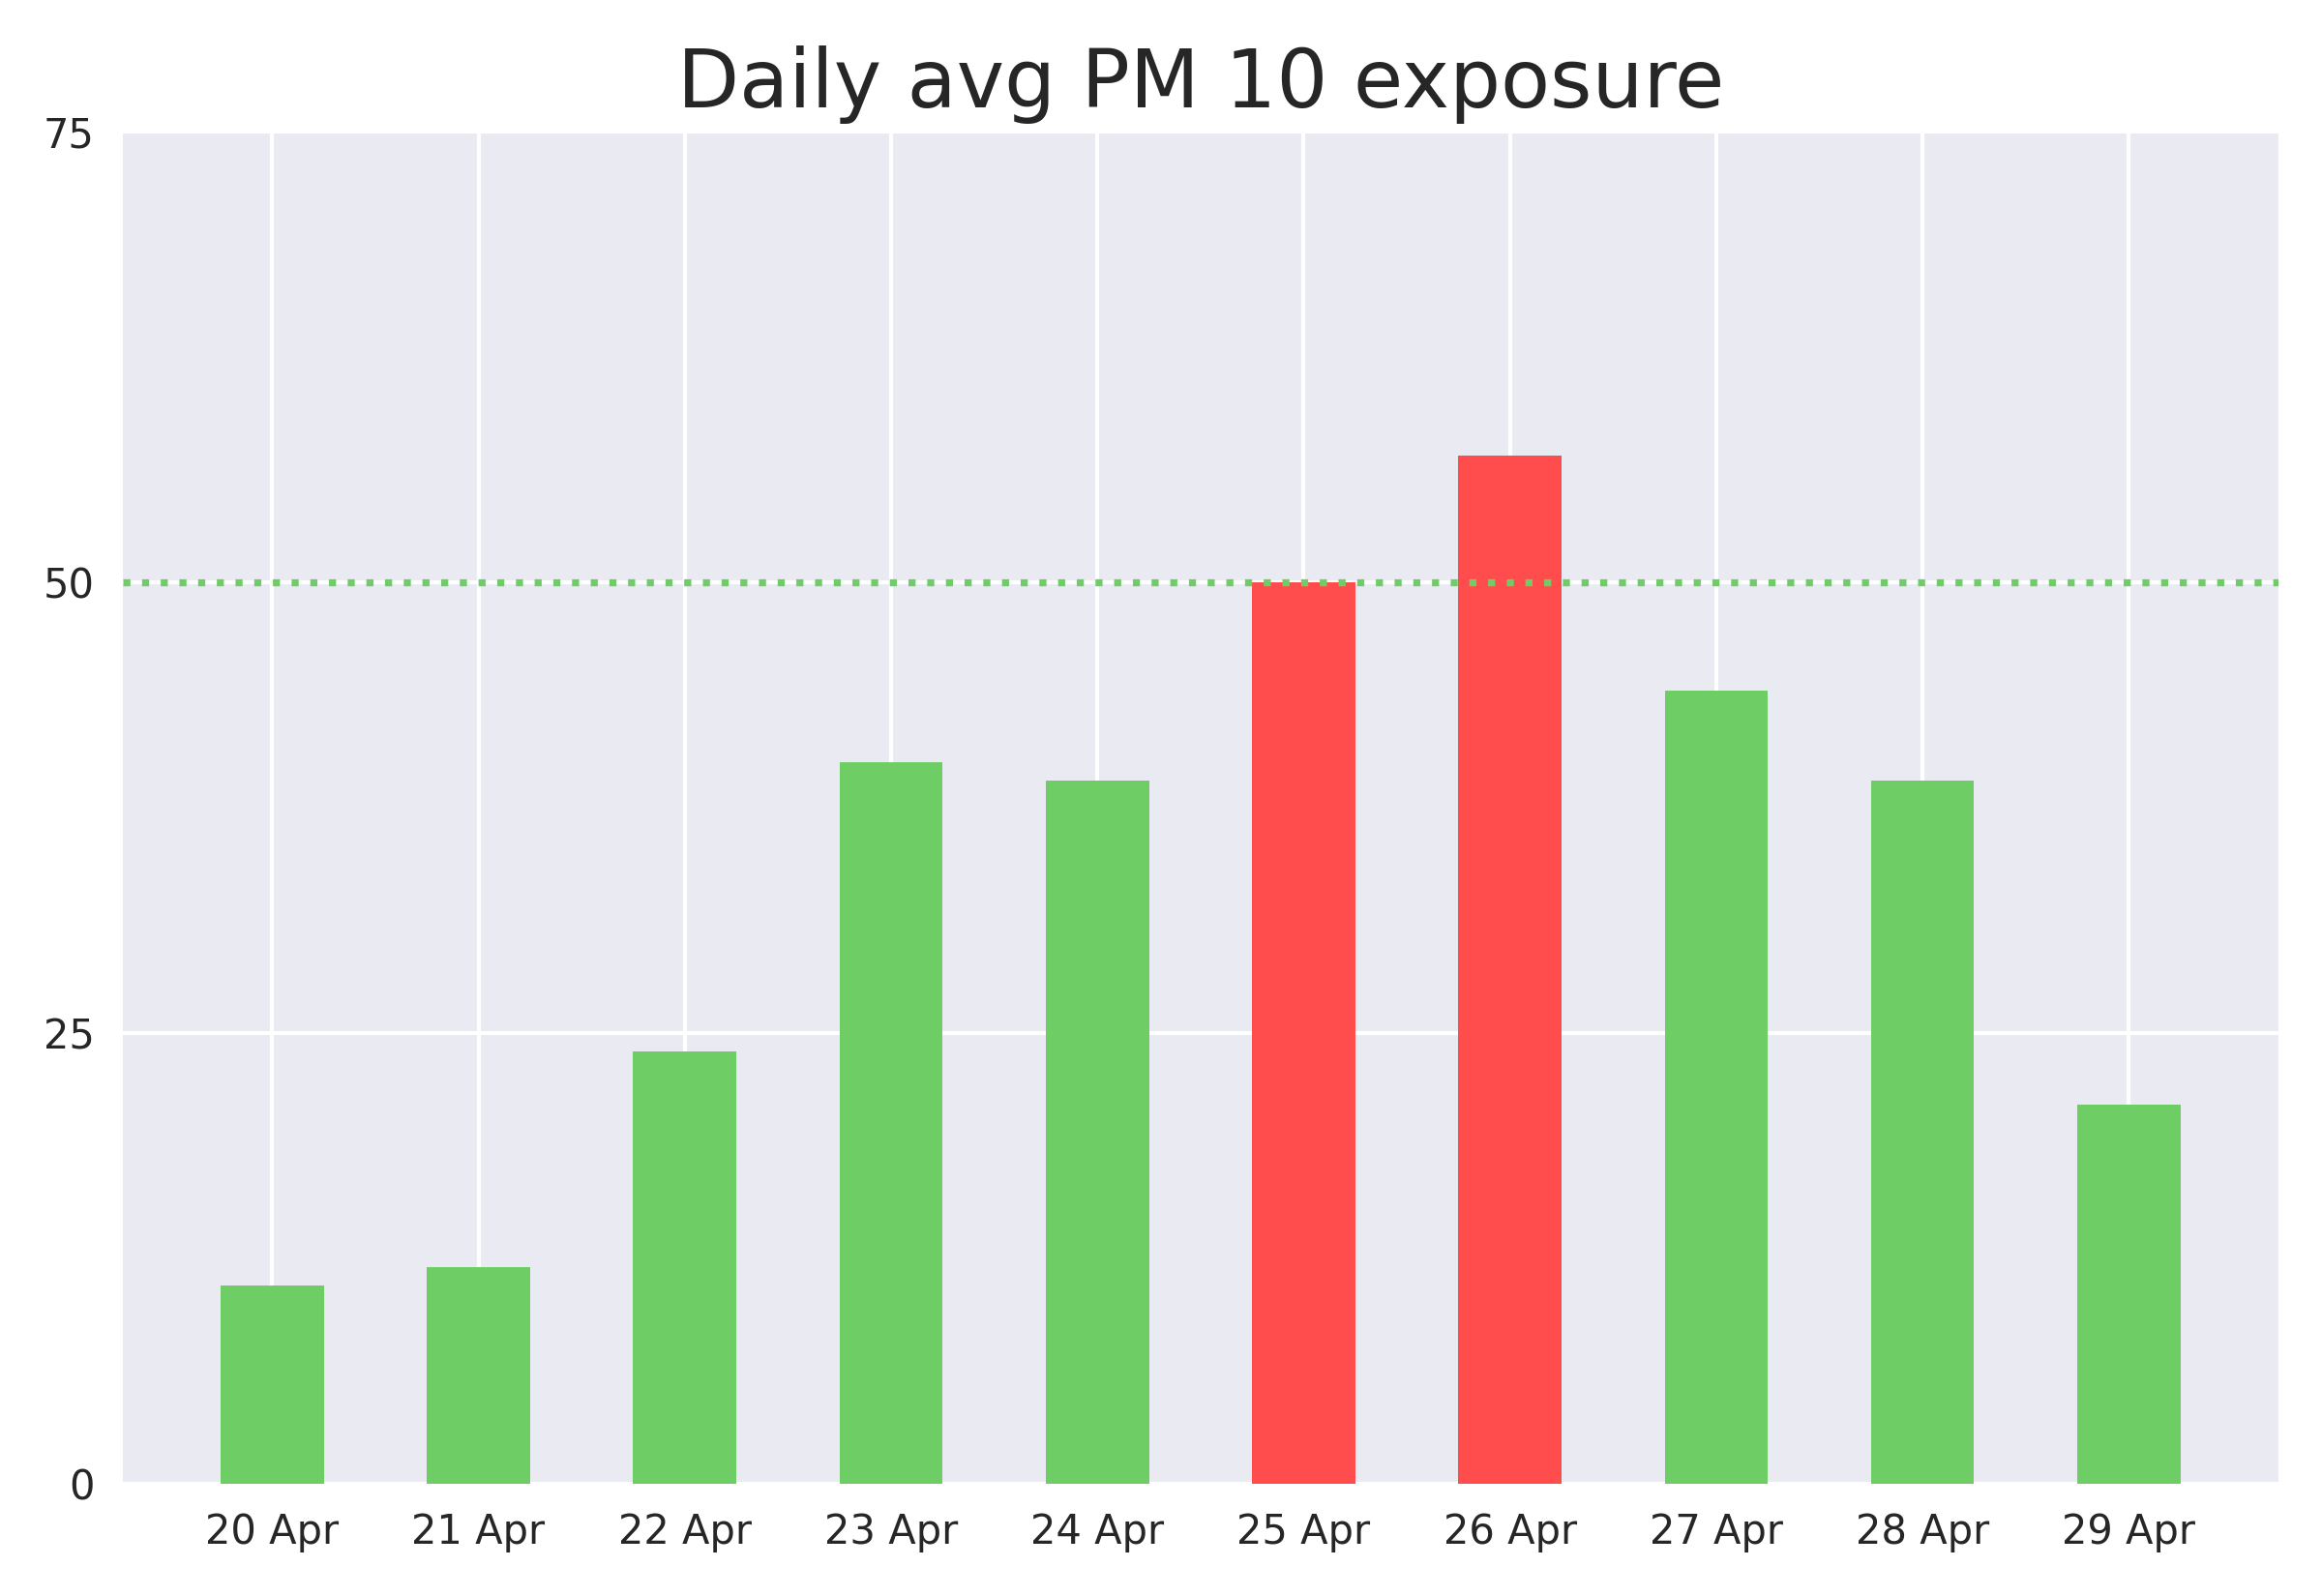
The threshold for the daily average PM 10 exposure is set to 50 µg/m³ by the WHO. Particles this size can penetrate and lodge deep inside the lungs but are too big to enter the blood stream. For this reason the threshold is higher.
In the 10 days overview you can see:
Green: Daily average exposure below 50 µg/m³
Red: Daily average exposure above 50 µg/m³
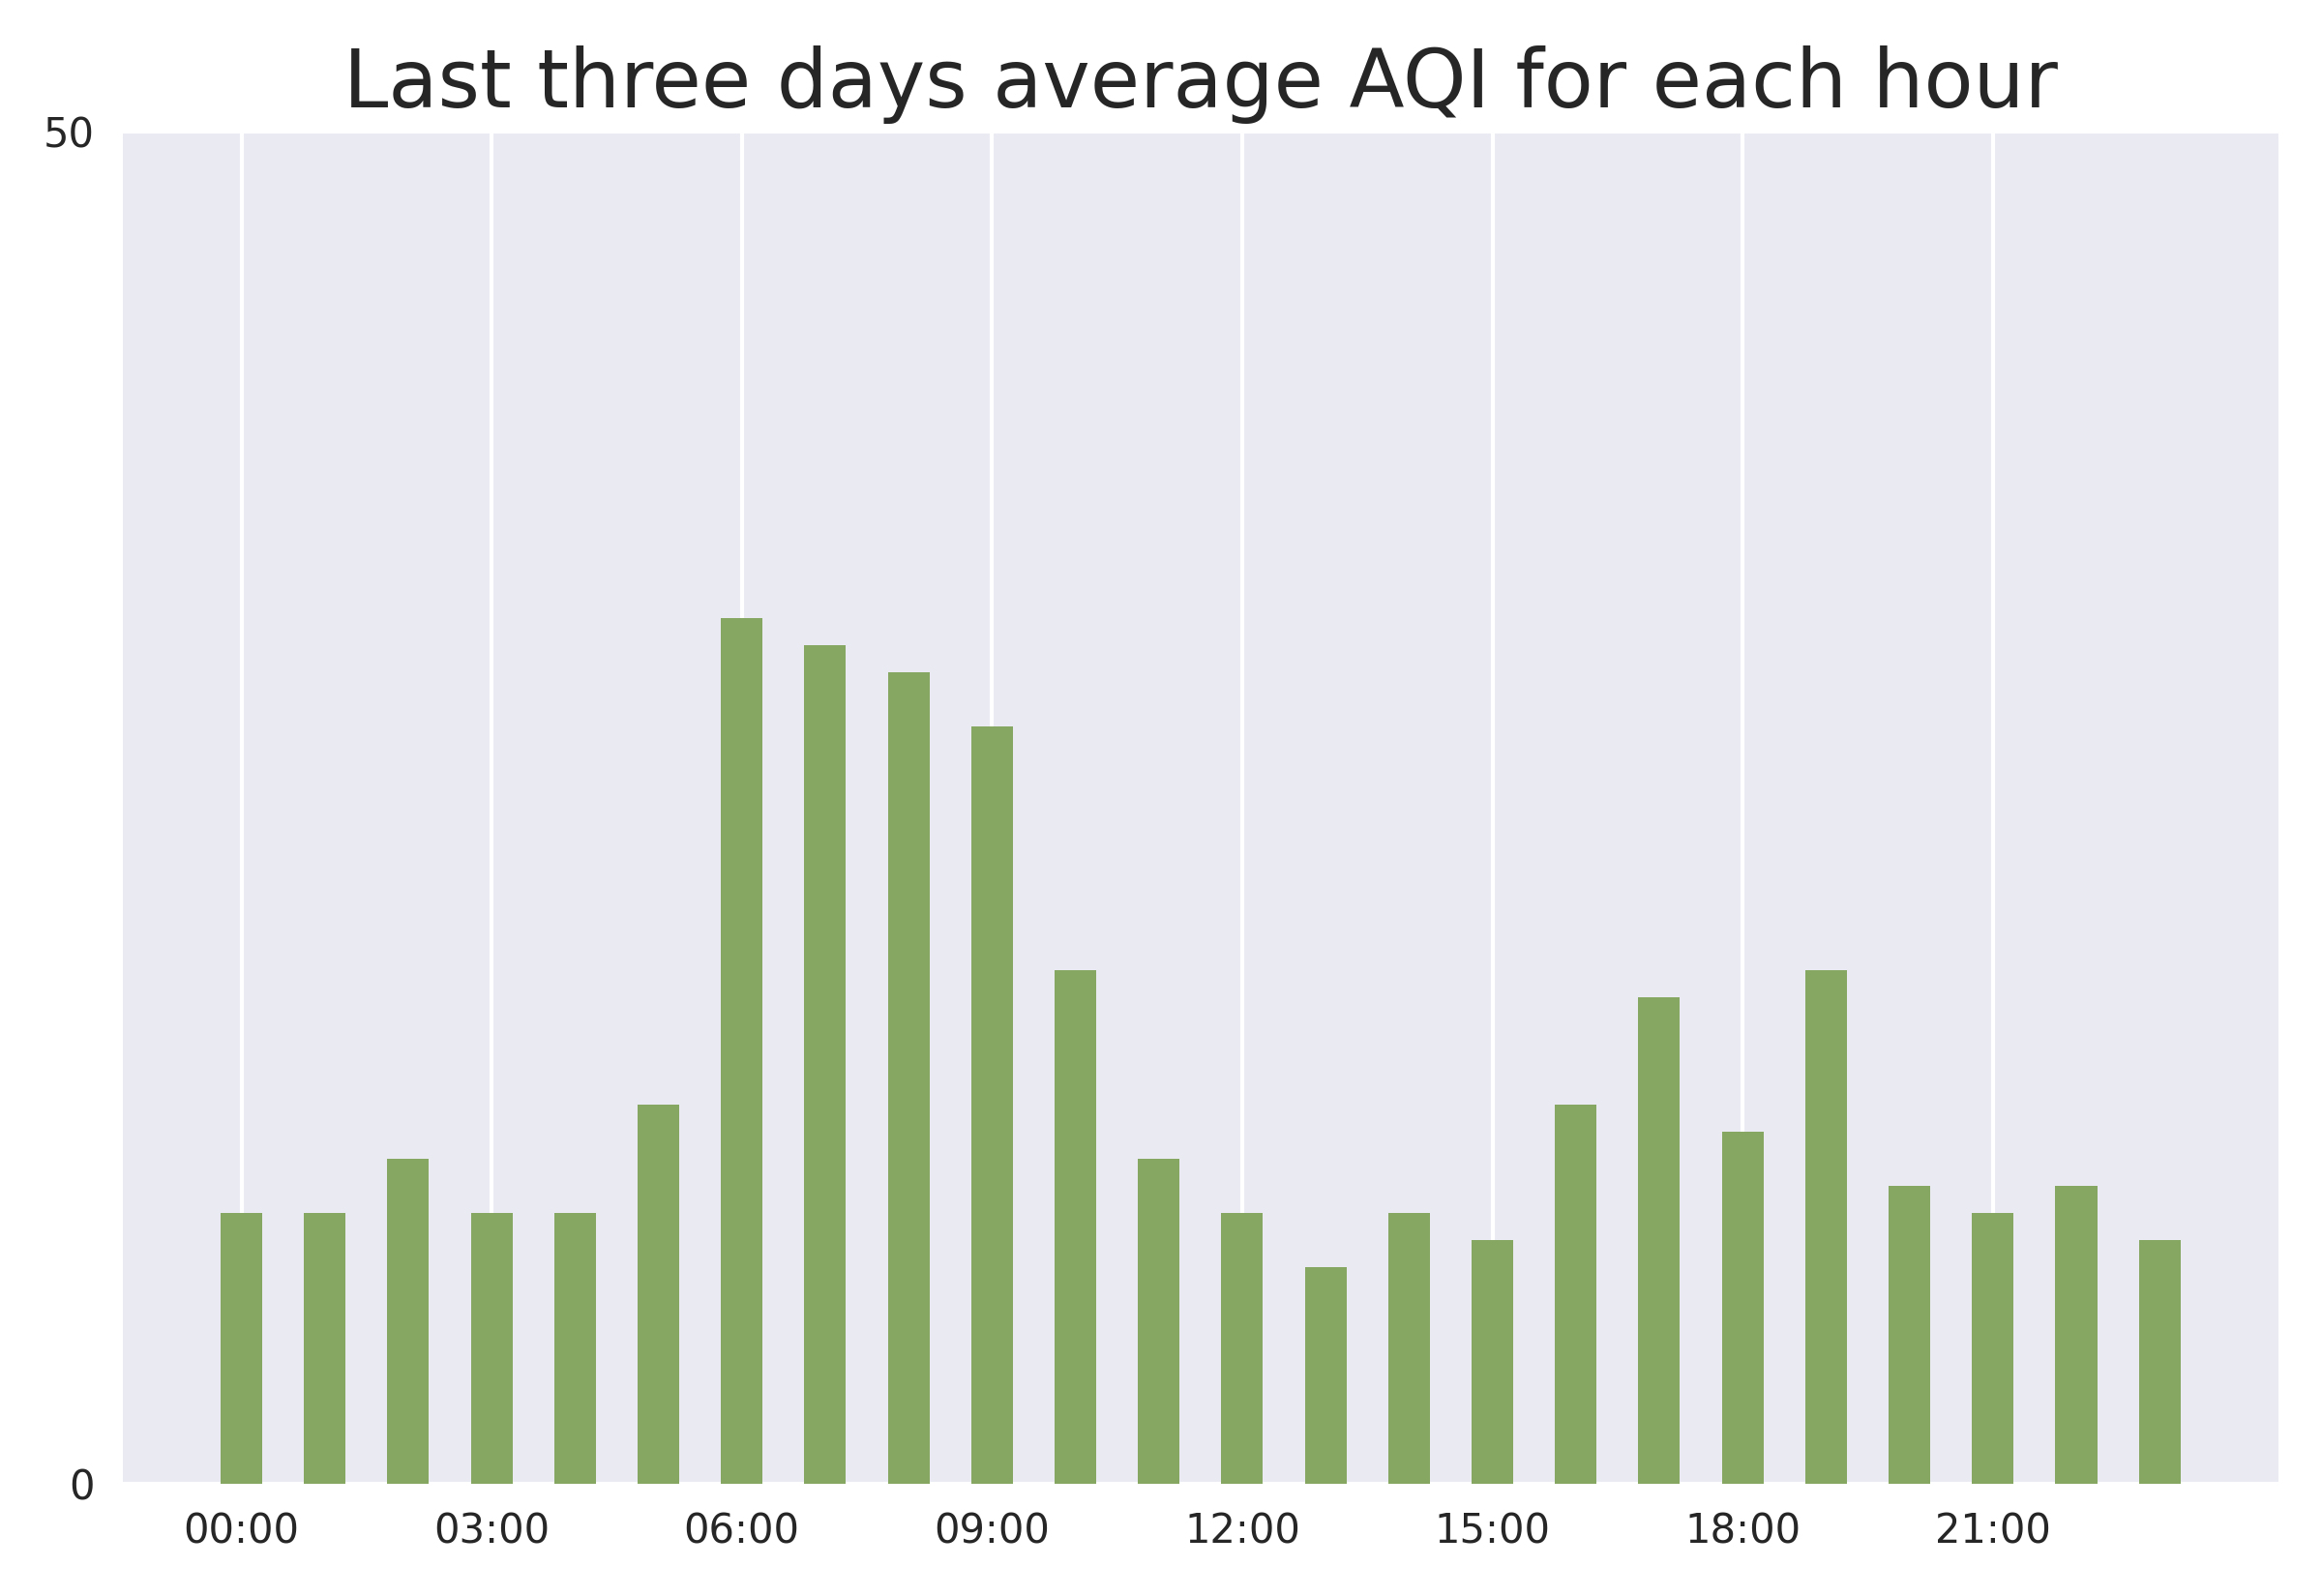
The AQI value can change a lot during the day. This can depend on the wind, cooking on fire or just another additional source of pollution nearby.
In this chart you can see the average AQI for each hour. This data is based on the last three days. This data can help to visualize which hours in the past three days have been better or worse on average.
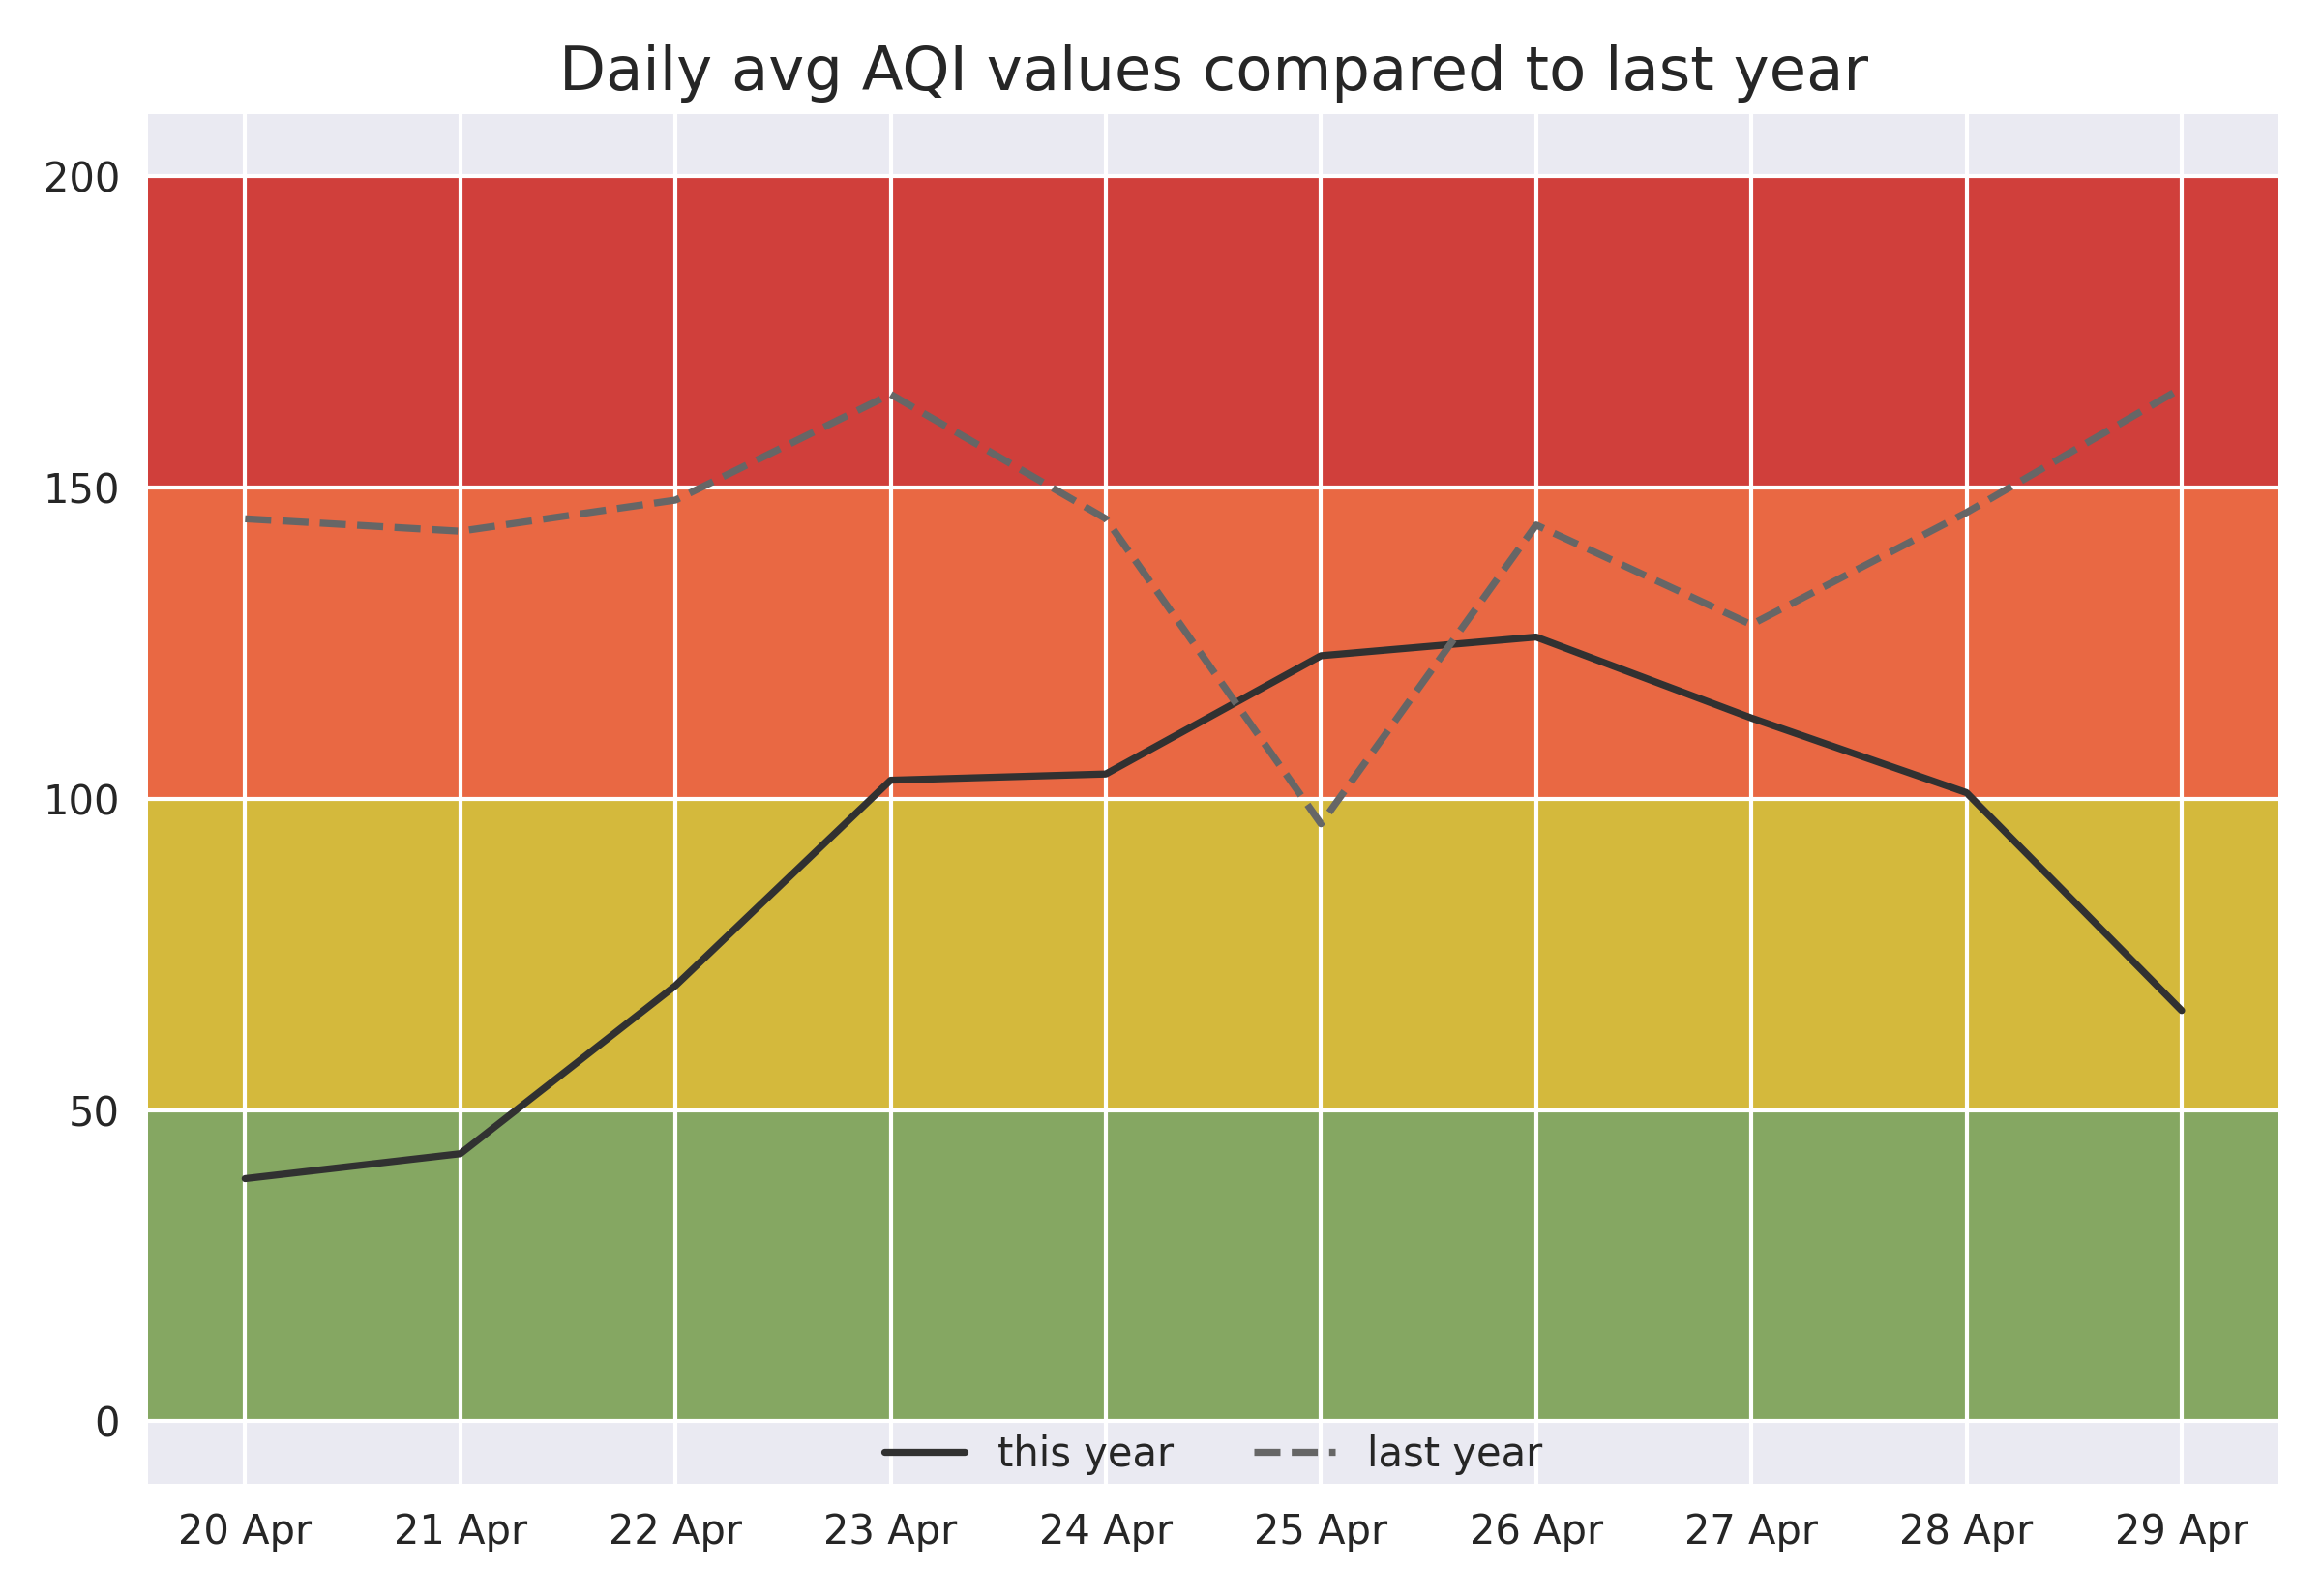
This year's daily average AQI values from last 10 days compared to corresponding values from last year.
| this year | last year | change | |
|---|---|---|---|
| avg 10 days | 13 | 27 | down |
| 20 Jun | 23 | 40 | down |
| 19 Jun | 13 | nan | nan |
| 18 Jun | 11 | 19 | down |
| 17 Jun | 12 | 17 | down |
| 16 Jun | 11 | 12 | same |
| 15 Jun | 10 | 16 | down |
| 14 Jun | 19 | 35 | down |
| 13 Jun | 13 | 45 | down |
| 12 Jun | 10 | 37 | down |
| 11 Jun | 9 | 26 | down |
© | Documentation